
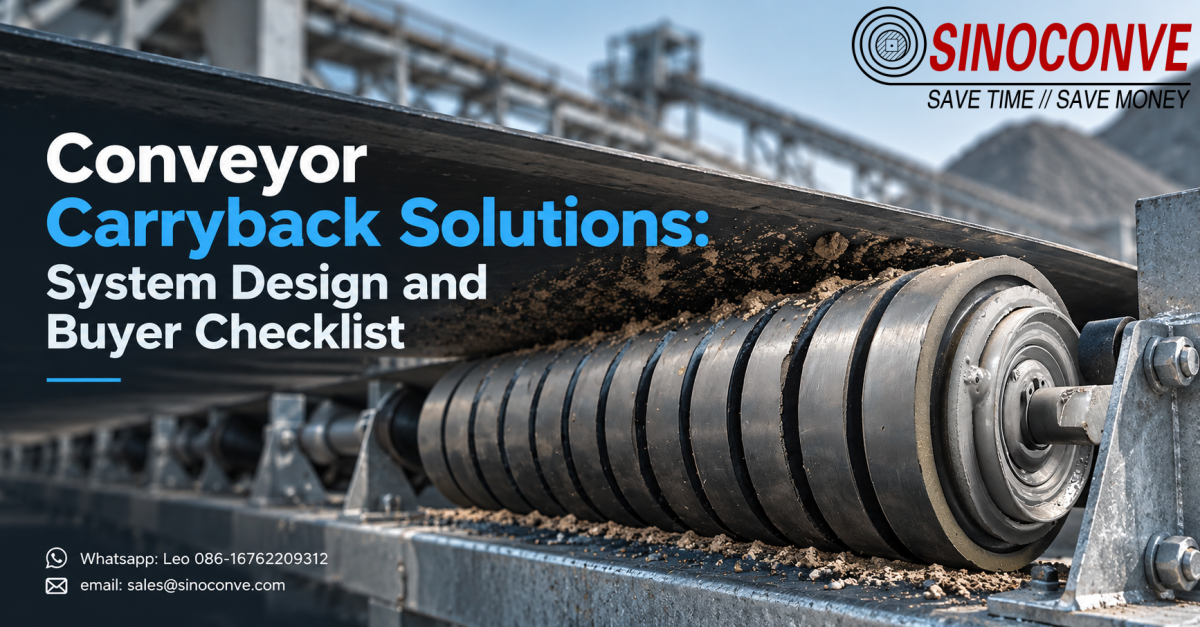
Carryback is the material that rides back on the return strand after the discharge point, and on most bulk handling lines it costs more every year than the belt that carries it. This page is written for the buyer and the maintenance engineer who have already read our cleaning articles and now want a number, a portfolio of fixes and a payback figure they can defend. Below you will find the loss formula you can recalculate with your own data, a four-family intervention matrix, a worked investment-return example, a ninety-day roadmap and a procurement checklist. There are no cleaning schedules here. Just the business case, and the arithmetic behind it.
01Carryback Is a Business Loss Before It Is a Housekeeping Problem
Walk the return strand of a poorly set conveyor and you will see material dribbling off the belt, piling under the structure and being dragged through the tail pulley by the metre. Plant teams usually treat that as a housekeeping annoyance and send a labourer with a shovel. The invoice says something different. That material was already paid for at the pit and already crushed at an energy cost, and now it is carried a second time for free, cleaned up at your expense and, on some sites, washed into a pond that later needs desludging.
Carryback damages the equipment side twice over as well. Fine material trapped between the belt and the return rollers behaves like grinding paste on the pulley lagging and the cover, and it accelerates wear on every idler in the return run. So the same kilogram of lost material appears as a material cost, a labour cost, a wear cost and, on regulated sites, a compliance exposure. Frame it that way and the argument stops being about tidiness and becomes about margin.

The Same Kilogram of Carryback Is Billed Four Times
Take one kilogram of limestone dust that adheres to the belt after the head pulley. You paid the quarrying cost to liberate it. You paid the crusher to reduce it. You paid the drive twice, because the kilogram is carried out and carried back. A cleaning blade removes part of it, and the remainder falls into the structure or a wash box, where it becomes somebody's hourly wage. No line item called carryback exists on a profit and loss statement, which is exactly why it survives for years unchallenged.
The first job, then, is to make it a line item. That means measuring it, converting the measurement to tonnes, converting the tonnes to money, and then adding the three costs that hide beside it. Cleaning labour, unplanned stops and compliance exposure all sit quietly outside the material figure. Nobody invoices you for carryback. The next two sections give the formula rather than a conclusion, because your numbers matter more than ours.
02Putting a Number on Carryback: The Annual Loss Formula
The physics is short. The mass of carryback leaving your discharge point each second is the volume swept by the residual layer as the belt moves, multiplied by the bulk density of the material. Volume per second equals belt speed in metres per second, times residual layer thickness in metres, times belt width in metres. Multiply by 3,600 for an hourly volume, by your annual operating hours for a yearly volume, and by bulk density for tonnes per year.
Written out, annual carryback in tonnes equals belt speed in m/s, multiplied by residual layer thickness in m, multiplied by belt width in m, multiplied by 3,600, multiplied by annual operating hours, multiplied by bulk density in t/m3. Every input is something your team can obtain or estimate except the residual layer, which is the one number worth measuring properly. A single shift with the cleaning device lifted and a catch tray under the belt gives a defensible figure, and it is usually larger than the number people assumed.
What the Formula Actually Needs From Your Plant Data
Six inputs are required, and five of them are already in your files. Belt speed, belt width, operating hours, bulk density and material value come from drawings, records, certificates and accounts that already exist. Only the residual layer thickness has to be measured on the machine, and that measurement is the entire credibility of the model. Get it wrong and the whole case collapses.
| Input variable and where it enters the loss model | Where to obtain it, and why it matters to the model | Typical range you should expect on an ordinary bulk line |
|---|---|---|
| Belt speed, the first multiplier in the whole calculation | Read from the drive data sheet, or measure it on the return strand with a tachometer. | Usually 2.0 to 4.0 m/s, with slower machines on steep inclines and fragile product. |
| Residual layer thickness, the one figure measured rather than assumed | Measured and never assumed, by lifting the cleaning device for one shift and collecting what still passes it. | Below 0.2 mm when the cleaning system is healthy, up to 1.0 mm when neglected. |
| Belt width, confirmed from the nameplate and a tape measure | Taken from the nameplate and confirmed with a tape, because a rebuilt frame rarely matches the drawing. | Fixed by the installation, commonly 800 mm to 1,600 mm on aggregates and ore. |
| Operating hours, taken from production records for a full year | Taken from production records rather than the calendar, since planned stops should not be billed to carryback. | Typically 4,000 to 6,000 running hours a year on a two or three shift pattern. |
| Bulk density of the product, from a certificate or bench test | From a lab certificate, or a simple bucket and scale test if the product varies. | Roughly 0.8 t/m3 for light product, up to 2.0 t/m3 for dense ore. |
| Material value per tonne, taken from your own accounts | Your own cost per tonne delivered to the belt, the figure that turns a tonnage into dollars. | Site specific, and it should be the conservative figure you can defend. |
A Measured Example From a Real Clinker Gallery
In a cement plant gallery we measured a residual layer of 0.35 mm on a 1,000 mm belt moving at 2.5 m/s, carrying clinker at a bulk density of 1.5 t/m3, across 5,000 operating hours a year. Volume per second is 2.5 times 0.00035 times 1.0, which is 0.000875 m3. That becomes 3.15 m3 per hour and 15,750 m3 per year, and at 1.5 t/m3 it is 23,625 tonnes of clinker returned to the tail every year. At a conservative material value of 8 dollars per tonne, the material loss alone is 189,000 dollars annually.
Nobody in that plant believed the figure until they watched the calculation move on a whiteboard. Once the tonnes were agreed, the argument ended in one meeting, because the number was three times the capital request.
03From Tonnes to Money: Material, Labour, Downtime, Compliance
Material value is the largest line on most dry bulk lines, and it is still only one of four. Only one of those four lines is easy to find. Add the labour hours spent on manual cleanup, the production hours lost when spillage forces a stop or a slow-down, and the cost of regulatory or contractual exposure. A plant that counts only the material value, and then measures every saving against that single line, will understate its own case, hand the budget to a project with tidier paperwork, and never learn what the other three lines were quietly costing.
Turning Those Annual Tonnes Into Money the Plant Accepts
The clinker plant from the previous section logged 750 labour hours a year on cleanup at 25 dollars an hour, which is 18,750 dollars. It also recorded 40 hours of carryback-related stoppage at a contribution margin of 1,200 dollars an hour, which is another 48,000 dollars. A single consent breach or reportable spill was valued at 15,000 dollars of expected annual cost, averaged across the years it might occur. Adding those to the 189,000 dollars of material loss gives a total annual exposure of 270,750 dollars before any capital is spent.
| Cost line, and the exposure it represents in the ledger | How we calculate it from your plant data | What it usually looks like once it reaches the ledger |
|---|---|---|
| Material lost as carryback, the largest line on most duties | Annual tonnes from the formula multiplied by material value per tonne, at a conservative rate. | The dominant line on most dry bulk lines, growing in step with throughput and moisture. |
| Cleaning labour absorbed into the general site labour accounts | Annual cleanup hours multiplied by the fully loaded hourly rate, including overtime. | Absorbed silently into general labour, rising as the cleaning system ages and spillage accumulates. |
| Downtime and slow-down caused by carryback-related stoppages on the line | Carryback-related stoppage hours multiplied by the contribution margin of the line they serve. | Under-recorded, because the cause is entered in the shift log as housekeeping, not as a failure. |
| Compliance and cleanup risk from spills, permits and reporting | Expected annual cost of spills, permits and contractor cleanup, averaged over the period. | Small in a good year, severe in a bad one, and specific to the site and its regulator. |
Two of those four lines are habitually under-recorded, and both flatter the status quo. Neither number ever appears as its own cost centre. Cleanup hours are absorbed into general labour, and stoppages caused by carryback are logged as housekeeping. Ask your shift supervisors to tag the cause properly for one month before you build the business case. We watched one maintenance team double the apparent size of its problem simply by naming it correctly.
If you source belts and rollers from a single conveyor belt supplier, you can also ask for the wear data your cleaning system is generating. Cover wear rate, edge wear and roller seizure all carry information about carryback, and a supplier who understands the interaction can read it back to you instead of quoting a replacement. Our conveyor belt factory in Ningbo keeps the test rigs and the records, and we are glad to walk a visiting engineer through an assessment.
04The Intervention Portfolio: Four Families of Practical Countermeasures
Once the loss is quantified, the temptation is to buy a larger cleaning device and move on. Resist that for a week and look at the whole portfolio first, because a cleaner is only one of four families of countermeasure and it is rarely the cheapest lever on the list. The four families are structural work on the transfer point, component work on the belt line, operational changes to how the line is run, and material-side changes to the product itself, and most projects that hold their gains touch at least three of the four while the ones that fail usually touched only the component row.
| Intervention family, and the lever it actually pulls | What it changes on the line, and where it applies | Boundary conditions and the cases where it does not apply |
|---|---|---|
| Structural work on the transfer point, chute, skirt and pulley geometry | It removes the conditions that create carryback by giving the material a clean release path and the belt a stable, centred run. Best value on new projects and on any transfer point being rebuilt for another reason, where the incremental cost is small. | Not worth dismantling a sound chute to chase a few percent, and it cannot rescue a torn belt or a product that is inherently sticky at ambient temperature. |
| Component work on the belt line: cleaners, return rollers, impact beds and tracking hardware | It intercepts or controls material after discharge and keeps the belt path stable, using hardware that can be replaced or re-tensioned without touching the structure. It is the fastest lever to deploy on an existing line and it fits a weekly shutdown window. | No cleaner can compensate for a wrecked belt surface, a slipping drive or a chute that floods the belt faster than the blade can follow. Components mask a structural fault for a few months, then wear out twice as fast. |
| Operational changes to speed, feed, routines and maintenance windows | It changes the operating envelope so the system generates less carryback and is inspected more often. Belt speed is the first term in the loss formula, so a modest reduction on a variable-speed drive pays back immediately. | Little help where throughput is contractual and fixed, and it never substitutes for a worn component. Treat it as a complement to hardware, not a replacement for it. |
| Material-side changes to moisture, wetting behaviour, fines content, binder and temperature | It attacks adhesion at source by making the product less likely to cling to rubber, which is often the highest-leverage option of all on a dry, dusty, electrostatically active bulk. | Cannot be applied where the product must stay dry for the process, or where added moisture would create a different problem in a kiln, a mill or a customer specification. |
Reading the Intervention Matrix Without Overselling a Single Row
We are a conveyor belt manufacturer and we sell hardware, so treat the component row with the scepticism it deserves. The matrix is ordered by leverage, not by what we would prefer to invoice you for. Structural work carries the highest leverage and the longest lead time. Component work carries moderate leverage and is available this week. Operational work costs almost nothing and is routinely ignored. Material work is often the highest-leverage option of all on a dusty, dry product, and it is the one most often left out of the conversation. A plant renewing several lines at once will usually land a lower delivered cost by taking wholesale conveyor belts and the roller set from one source than by splitting the order across three.
05Structural Interventions: Chutes, Skirts and Pulley Geometry Explained
Structure decides how much material ever touches the belt in the wrong place. A discharge chute that is too small for the maximum lump size, or a skirt not sealed against the belt, spills material onto the return side before a cleaning device sees it. Getting the discharge trajectory right means the bulk stream leaves the belt cleanly instead of dribbling over the chute edge.
Chute Geometry, Skirt Sealing and Their Effect on Release
A discharge chute should be sized from the maximum lump size and the design capacity, not from the length of pipe that was left over from the previous project. We look for a chute that gives the stream a straight path with a minimum of ledges, because every shelf becomes a place where fines collect, compact and eventually drop onto the return belt in one lump. Skirt rubber should contact the belt evenly along its full length and be set to a light, uniform pressure. Over-tightened skirts press material into the cover and generate more carryback than they prevent.
Pulley Diameter and Belt-Line Alignment
The head pulley is where the belt should release its load, and pulley diameter is part of that release. If the pulley is undersized for the belt construction, the belt does not flex cleanly at the discharge point and material can be pinched against the pulley face rather than thrown clear. For a heavy duty industrial conveyor belt running at high tension, the pulley diameter is specified together with the carcass, not chosen later from a catalogue.
Alignment matters just as much as diameter. A belt that runs slightly crooked against the skirt or the chute wall is being abraded continuously and, in effect, ground against a fixed object. Running the belt true is unglamorous work, and it is often the single change that finally lets a cleaning system do its job. The belt tracking guide we published walks through the causes of misalignment in order of how often we actually meet them on site.
06Component Interventions: Rollers, Idlers and Tracking Hardware
Rollers, Idlers and Tracking Hardware
Components are the fastest lever because they can be installed during a normal weekly shutdown, and the return run is where they earn their keep. Carryback that has already passed the last cleaning device lands on the return rollers, and if those rollers are worn, seized or covered in build-up, they redistribute that material back onto the belt and into the structure. The conveyor roller is therefore part of the carryback discussion even though it is not a cleaning device.
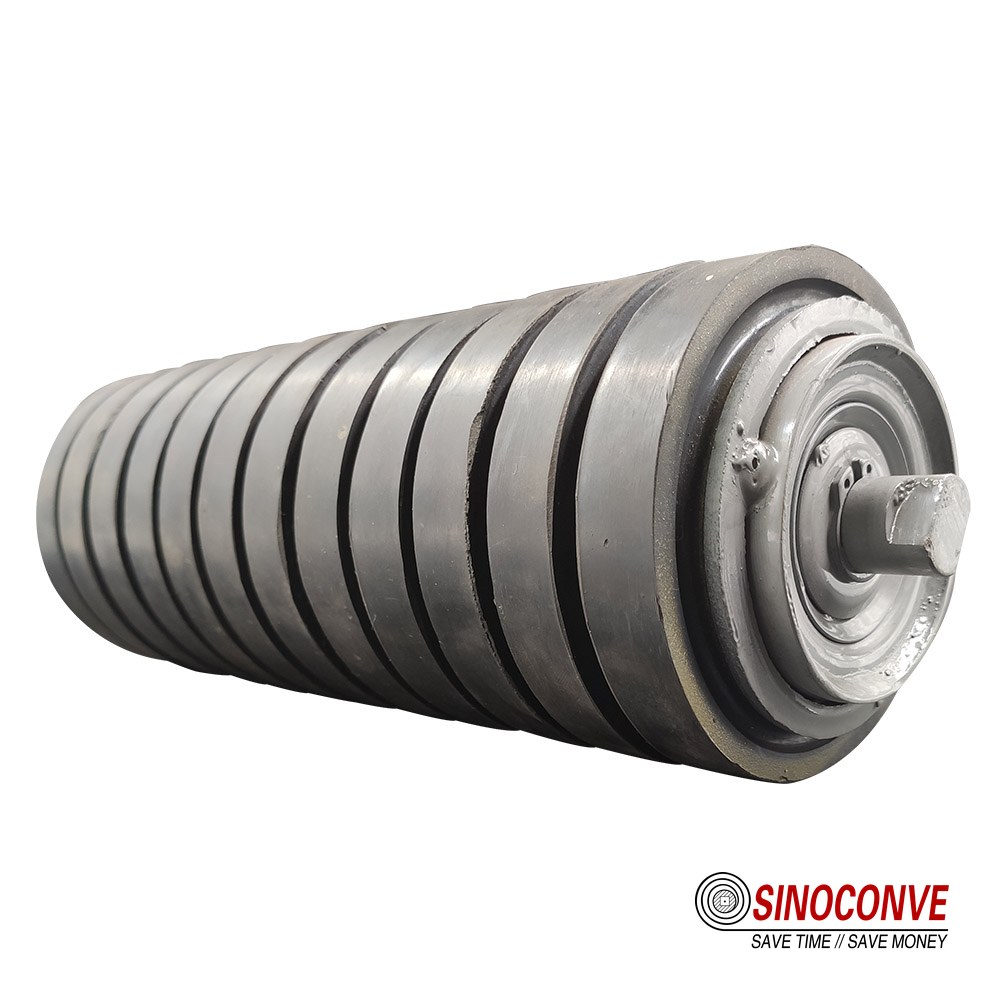
Sealed return rollers matter more than buyers expect on a dusty line. A roller that cannot keep fines out of its bearing will stop turning, and a stopped roller under a loaded belt becomes a cutting tool. On fine, aggressive dust we specify sealed units, and we have seen return-run roller life improve from months to years on the same conveyor simply by keeping the bearing clean. This is not a scraping solution, it is a stabilising one, and it belongs in the same budget line because it controls what the cleaner leaves behind.
Field note from our engineers: On a copper concentrator we surveyed, the return strand was carrying heavy build-up under the loading zone, and the plant had already budgeted for a larger cleaner. We fixed the belt tracking and replaced eleven seized return rollers first.The residual layer fell by more than half before a single blade was bought.
Tracking aids complete the set.A belt that wanders is a belt that is being abraded at the edges and loaded unevenly, and both conditions increase carryback. Self-aligning idlers and a correctly crowned pulley bring the belt back to the centre line without drama. For the belt itself, a rubber conveyor belt with a properly specified cover resists the abrasive action of trapped fines far better than a belt chosen on purchase price alone, and our roller selection guide covers load ratings and materials for the return side in detail.
07Operational Interventions: Speed, Throughput and Maintenance Windows
The cheapest lever is usually the one nobody wants to pull, because it touches production. Belt speed is the first variable in the carryback formula and also one of the easiest to change on a variable-speed drive. On a line where the drive is already oversized, a small reduction in speed may cost nothing in output and everything in the amount of material that comes back on the return strand.
Speed Reduction and Feed Control
Reducing belt speed by ten percent reduces carryback generation roughly in proportion, because the swept volume falls with the speed. Throughput changes are more delicate, since on a fixed-duty line the output is contractual. Even so, there is usually slack in how the line is loaded. A chute that is over-fed for part of the shift pushes the belt past the point where the cleaning devices can cope, and the excess simply rides back. Matching feed to the design capacity is an operational change that costs nothing and removes the peaks that defeat the hardware.
Maintenance windows belong in this family too. A carryback programme dies quietly when cleaning hardware is not inspected on a schedule, because blades wear, tensioners relax and rollers seize at different rates. Booking a short inspection into the existing weekly shutdown is more effective than any large one-off intervention, and it is the difference between a project that holds its payback and one that fades within a year. The same routine argument applies to the drives, and plenty of maintenance planners keep a V-belt manufacturer on the approved list for exactly that reason.
Measuring Carryback Without a Laboratory
You do not need a laboratory to measure the residual layer. Isolate one cleaning device, position a tray or a sheet of plastic under the belt just behind it, and run the conveyor at normal load for a measured interval. Collect everything that lands, weigh it, and divide by the belt area that passed the point in that interval. The result is a mass per square metre, which converts directly to a layer thickness when you divide by bulk density, and it is honest enough to put in front of a plant manager.
Repeat the measurement at three points along the belt and at two feed rates, because carryback is rarely uniform. Material at the edges behaves differently from material in the trough centre. Record the numbers with the date, product and moisture condition, and you have the baseline every future claim is checked against.
08Material Interventions: Moisture, Fines, Binder and Temperature
Moisture, Fines, Binder and Temperature
Adhesion is a material property before it is a machine problem, and that is why the material row sometimes beats every piece of hardware on the list. Dry, fine, dusty product with a high clay or binder content clings to rubber with almost no help from the operator, while the same product at a slightly higher moisture content can behave completely differently. In one quarry we measured a residual layer of 0.9 mm on a bone-dry granite fines duty, and the same belt with a modest, controlled wetting at the loading point dropped below 0.3 mm without any change to the cleaner.
Temperature belongs in the same conversation. A product that is warm and slightly plastic at the transfer point will press into the cover and hold there, while a cold, brittle product tends to release. On heat duty, the belt itself has to be specified for the temperature, and a heat resistant conveyor belt with the correct compound is not a luxury but the condition that makes any cleaning strategy possible at all. Fines content can also be managed upstream, and reducing the amount of minus-5 mm material reaching the belt is often cheaper than any downstream fix. Plants that also run heavy drive systems should apply the same discipline on that side of the plant, and a transmission belt manufacturer will tell you that drive wear patterns carry the same kind of clues that cover wear does on a conveyor.
For wet or sticky product on an incline, geometry and belt type start to matter as much as adhesion. A belt with a profiled carrying surface holds material on the incline that a smooth belt would shed back down the slope, which changes the carryback picture entirely. Buyers who handle sticky bulk across several sites often consolidate these variations through a conveyor belt distributor arrangement rather than from a single catalogue, because the profile geometry has to be matched to the duty rather than picked off a shelf.
09A Worked Investment-Return Example
Numbers persuade where adjectives do not, so here is the full ledger for the clinker gallery we measured earlier. The plant accepted an annual carryback exposure of 270,750 dollars across material, labour, downtime and compliance, and it wanted to know whether a package of countermeasures would pay for itself inside the budget year. We kept the capture assumptions deliberately conservative, because an optimistic capture rate is the fastest way to lose credibility the first time the plant manager audits the result.
The Investment Side of the Ledger
The capital package we costed included primary and secondary cleaning assemblies with tensioners delivered and installed at 28,000 dollars, sealed return roller replacement across sixty positions at 9,000 dollars, chute and skirt modification with labour at 16,000 dollars, tracking and idler alignment work at 7,000 dollars, and engineering, commissioning and baseline measurement at 6,000 dollars. That is a total investment of 66,000 dollars, and it deliberately spans three families of the matrix rather than leaning on the component row alone.
On the saving side we assumed a seventy percent capture of the material loss, sixty percent of the cleaning labour, fifty percent of the carryback-related downtime and sixty percent of the expected compliance cost. Those rates are not heroic. A well-installed system on a reasonably clean duty will beat them, and a system installed on a structurally poor transfer point will miss them, which is precisely why the structural work is in the package. Against a new ongoing maintenance cost of 4,000 dollars a year for blades, seals and inspection, the arithmetic runs as follows.
| Ledger line | Basis | Annual amount (USD) |
|---|---|---|
| Material recovered | Seventy percent of the 189,000 dollar material loss, the balance being unrecoverable on a sticky duty. | 132,300 |
| Cleaning labour avoided | Sixty percent of the 18,750 dollar cleanup labour bill, with the remainder retained for routine inspection. | 11,250 |
| Downtime avoided | Fifty percent of the 48,000 dollar contribution margin lost to carryback-related stoppages. | 24,000 |
| Compliance risk reduced | Sixty percent of the 15,000 dollar expected annual spill and permit exposure. | 9,000 |
| Gross annual saving | The four lines above added together, before any new running cost is deducted. | 176,550 |
| Less new maintenance cost | Replacement blades, seals and scheduled inspection introduced by the new equipment. | 4,000 |
| Net annual saving | Gross saving minus the new maintenance cost, which is the figure the payback should be measured against. | 172,550 |
| Capital investment | Hardware, installation labour, alignment work and engineering for the full package described above. | 66,000 |
| Simple payback | Capital investment divided by net annual saving: 66,000 divided by 172,550, which is 0.38 years. | About 4.6 months |
That is the conclusion the plant took to its investment committee: a 66,000 dollar package returning roughly 172,550 dollars a year, with payback inside five months and the equipment still carrying residual value after that. The same model works on a smaller line if you scale the inputs honestly. What it will not survive is a decision to buy only the cleaning hardware and skip the structural and material work, because the capture rates used above assume all four families are addressed.
10Reading the Payback Result Honestly
Where the Estimate Can Be Wrong
A payback model is a decision aid, not a promise, and the honest ones say where they are fragile. The material value assumption is the largest single sensitivity, because a plant that values its product internally at a transfer price will compute a very different number from one using the external sales price. Our advice is to run both and to present the lower figure, since a plan that survives the pessimistic case is far harder to argue against.
The capture rates are the second sensitivity. Seventy percent material capture assumes the belt surface is sound and the transfer point is not flooding the belt, and on a line where the cover is already grooved or torn, the real figure could be half that. That is not a reason to abandon the project. It is a reason to sequence it properly, fixing the structure and the belt surface first and buying the cleaning hardware once the belt it has to work against is worth cleaning.
One caution about equipment sourcing. A buyer who chases the lowest cleaning hardware price and then pairs it with a mismatched belt is optimising one line of a nine-line sum. Working with a single transmission belt manufacturer for the drive side and a single belt source for the conveying side removes a layer of finger-pointing when a joint fails or a cover wears early, and it is often cheaper in total even when the unit prices are not the lowest you can find.
11The Ninety-Day Remediation Roadmap
Sequencing matters as much as spending. A plant that buys cleaning hardware first and fixes the structure later will wear the hardware out on a belt that was never going to release its load cleanly, and the project loses its champion by month six. The order below is ranked by impact per dollar, and it begins with work that costs almost nothing, because the fastest wins on a carryback programme are usually organisational rather than capital.
The First Ninety Days
Days one to ten are for measurement, not purchase. Establish the baseline residual layer, log cleanup hours properly for two weeks and tag every stoppage whose root cause is carryback. Without that data you cannot prove the improvement later, and you cannot defend the next budget cycle either. It is the least glamorous step in the plan and the one that decides whether the rest of it survives.
| Phase | Action, and what it involves on site | Why it ranks in this position |
|---|---|---|
| Days 1 to 10 | Measure the baseline: residual layer, cleanup hours and carryback-related stoppages on the two worst conveyors, with dates, product and moisture recorded. | Almost no capital cost, and it converts an opinion into a number a plant manager cannot dismiss. |
| Days 10 to 25 | Fix what is free: re-set skirt pressure, correct belt tracking, replace seized return rollers and restore cleaner tension to specification. | The highest return per dollar in the whole plan, because most of it is labour your own crew already has on shift. |
| Days 25 to 45 | Address the material: trial controlled wetting or a moisture adjustment on the dustiest duty, then re-measure the residual layer on the same belt. | Frequently the single largest reduction available, and it can be tested on one conveyor before any roll-out is approved. |
| Days 45 to 70 | Rebuild the worst transfer point: chute geometry, sealed skirts and pulley condition on the conveyor that showed the highest measured loss. | The most expensive single item, so it should follow the measurement rather than lead it. |
| Days 70 to 85 | Specify the cleaning hardware against the measured duty and install it on the rebuilt conveyor, with acceptance tests agreed in advance. | New hardware only performs once the belt surface and the transfer point are worth cleaning. |
| Days 85 to 90 | Re-measure everything to the same method and write the result into the next capital request for the remaining conveyors. | It closes the loop and leaves a documented before-and-after instead of an anecdote. |
Notice what sits at the front of that sequence. No cleaner is purchased until day seventy, because the cleaner is the last thing that should be specified and the first thing most plants buy. If you only have budget for three actions this quarter, take the measurement, the free adjustments and the material trial, and let the rest wait for the next cycle.
12Months Four to Twelve: From Fix to Standard
Ninety days wins an argument. Twelve months wins a habit. The difference between a plant that sustains a carryback reduction and one that is back where it started is whether the fixes became standards, and standards are dull, repeatable and written down.
Making the Result Permanent
First, the residual layer measurement becomes routine. Put it on the annual maintenance calendar for every critical conveyor and file it beside the vibration and lubrication records. Once the number is on a chart it is hard to let it drift, and it gives the next maintenance engineer a starting point that cost the previous one two shifts to establish.
Second, the specification changes. When the next belt is ordered for that conveyor, the cover grade, skirt condition and pulley diameter should reflect what the measurement taught you rather than what the original drawing happened to say. A supplier who quotes only a width and a length will cheerfully sell you the same belt that failed last time.
Third, the accountability has to sit somewhere. Carryback crosses the boundary between production, maintenance and the process team, and problems that cross boundaries are the ones that get dropped. Name one owner for the programme, give them the baseline numbers and review the chart once a quarter. That structural change outlasts every piece of hardware in this article.
13Procurement Checklist and Acceptance Criteria
When the time comes to buy, the purchase order does the work that a conversation cannot. A cleaner, a roller set or a chute modification bought on a verbal understanding will be argued about at handover, and the argument usually ends in a compromise that satisfies nobody.
What to Put in the Purchase Order
Start with the duty, not the part number. State the belt width, belt speed, material, bulk density and temperature, the maximum lump size and the measured residual layer you are trying to remove. Then state the environment, including ambient temperature, whether the area is dusty or wet, and whether the transfer point has any history of flooding. A vendor who receives that data can size the equipment for the duty, and one who does not will guess.
Next, demand the drawings. For anything that touches the belt, ask for a dimensional drawing showing the installation envelope, the mounting positions on the existing structure and the clearances to the belt edge. Require the material specification for every wear part, including the grade of the blade tip and the seal class on any roller. Put the lead time, spares list and warranty in writing as industry-typical ranges, subject to actual working conditions and drawing confirmation.
Acceptance Criteria You Can Measure
Acceptance should be measurable at handover rather than assessed by impression six months later. Agree the tests before installation, run them with both parties present and record the results on the same form.
| Acceptance criterion | How it is verified on site | Pass condition |
|---|---|---|
| Residual layer after cleaning | Catch-tray measurement behind the final cleaning device, taken at normal load and repeated at two points along the belt. | Measured thickness at or below the agreed target, for example 0.3 mm on the duty in question. |
| Carryback accumulation under the return run | Visual inspection plus weighed collection over a defined running interval, compared with the recorded baseline. | No visible build-up at the tail pulley and a measured mass below the agreed starting figure. |
| Belt tracking and edge condition | Observation across a full shift at working load, with the belt edges checked against the skirt and chute walls. | Belt stays centred within the agreed tolerance and shows no new edge scuffing. |
| Power draw of the drive | Reading from the drive panel before and after installation, under comparable load. | No increase beyond the agreed allowance, confirming the new hardware is not dragging on the belt. |
| Cleaner blade and tensioner condition | Physical inspection after an agreed running period, with blade wear measured and tension checked. | Wear within the stated rate and tension held without repeated adjustment. |
| Documentation and spares | Review of delivered drawings, material certificates, spares list and maintenance instructions. | All documents supplied, complete and matching the installed equipment. |
Write the pass conditions into the purchase order and hold the final payment against them. That one habit improves the quality of carryback work more than any specification detail, because it aligns the vendor's interest with the result instead of with the shipment.
14How This Page Divides Labour With Our Five Cleaning Articles
We have written about cleaning and carryback five times before, and this page deliberately does not repeat any of that ground. If you have read one of those pieces and wondered how it relates to the business case here, the division of labour takes two minutes to explain.
Cleaning methods and schedules covers how to clean and how often, including the cases where no scraper will work at all. Spray cleaning systems deals with water-based suppression of dust and carryback at the transfer point. Return-side belt cleaning goes into the geometry and the components on the return strand, which is a hardware question we have left alone here. Our piece on the conveyor belt cleaner covers selection and application of the cleaning device itself.
Two older articles sit outside this scope. The piece on reducing carryback sludge deals with what happens once the material is wet and collected, and the article on cleaning system integration covers how the cleaning subsystem fits into the wider conveyor line. Neither asks the question this page asks, which is what the carryback is costing you and whether the fix pays for itself.
If your problem is one of the five, start there. If your problem is that you cannot yet justify spending money on any of them, start here, run the formula and the payback model on your own numbers, and take the result to whoever signs the cheques. When you are ready to price the hardware, our conveyor roller range and the belt lines behind it are the place to begin, and the industry pages for mining and quarrying and port bulk material handling show how the same package comes together on comparable sites.

15Frequently Asked Questions About Conveyor Carryback Solutions
What exactly counts as carryback?
Carryback is any material that stays on the belt past the discharge point and comes back on the lower strand. It includes the thin layer that a healthy cleaning system leaves behind, and it includes the lumps and slurry that a damaged or neglected system dumps into the structure.
How much does carryback cost a typical plant?
Enough to justify capital on its own in most cases. Our clinker example produced roughly 23,600 tonnes a year and about 270,000 dollars of total annual exposure. The figure that surprises people is rarely the material value. It is the labour nobody ever isolated on a cost centre.
Is carryback a maintenance problem or a design problem?
Both, and that is why single-minded fixes fail. Design sets how much material ever reaches the wrong place, and maintenance decides how much of it is recovered. A plant that only improves maintenance is polishing a structurally poor transfer point, while a plant that only rebuilds the chute still needs the routine.
Can we reduce carryback without buying any new equipment?
Yes, and the first ten percent usually comes free. Correct skirt pressure, belt tracking, cleaner tension and seized return rollers are all labour rather than capital, and on the conveyors we survey they recover a meaningful share of the loss before a single purchase order is raised. Measurement comes first, because you cannot prove the gain without a baseline.
How thick a residual layer should we accept?
Below 0.2 mm is a well-kept line, and anything above 0.5 mm is worth investigating. The number is not a target you chase for its own sake. It is a diagnostic, and if the layer grows between inspections then something in the system has changed.
Does a wetter material really reduce carryback?
Often, but the effect is not unlimited. A controlled amount of moisture can collapse the electrostatic cling of dry fines and cut the residual layer substantially, as we saw on a granite fines duty where 0.9 mm fell below 0.3 mm with no change to the cleaner. Add too much water and you create sticky paste and a sludge problem downstream.
Why does a new cleaning system stop working after a year?
Almost always because one of the other three families was never addressed. The blade wears against a belt surface that has been grooved by trapped fines, the tensioner is never adjusted, the return rollers seize and the transfer point still floods the belt at peak feed. Hardware wears at the rate the rest of the system allows, and a neglected system wears it fastest.
Does belt speed matter enough to change it?
It is the first term in the loss formula, so yes. A ten percent reduction in speed reduces the volume of material swept back roughly in proportion, and on a variable-speed drive that change is often free in throughput terms. Ask the process engineer before you touch it, but do ask.
What payback should we expect from a carryback project?
Under a year in most cases we model, and often well under it. The example in this article paid back in about 4.6 months on conservative capture assumptions. If your model says ten years, either the loss is genuinely small or the capture rates have been set so pessimistically that the project should be re-scoped rather than abandoned.
Where should we start with only one shutdown window?
Measure first, then fix what is free. Use the window to re-set skirts and tracking, replace seized return rollers and restore cleaner tension, and take a catch-tray measurement while the belt runs normally afterwards. Table the capital work for the next window once you have a number, because the number is what unlocks the rest.
Related Products You May Need
- Rubber belts built for abrasive bulk duty
- EP fabric belts for aggregate and quarry lines
- Steel cord belts for long overland runs
- Heat resistant belts for clinker and sinter
- Carrying and return rollers for the same duty
- Full product catalogue